Financial Information
Management Indices(Profitability)
*IFRS is applied from FY2025. Figures for FY2024 also comply with IFRS.
(%)
| 2021/4 |
2022/4 |
2023/4 |
2024/4 |
2025/4 |
|
|---|---|---|---|---|---|
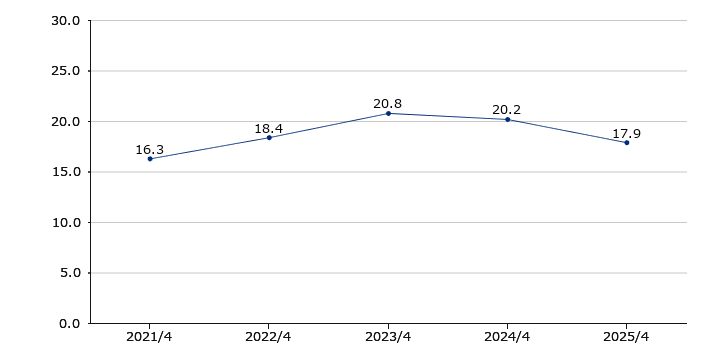
| Gross profit ratio | 16.3 | 18.4 | 20.8 | 20.2 | 17.9 |
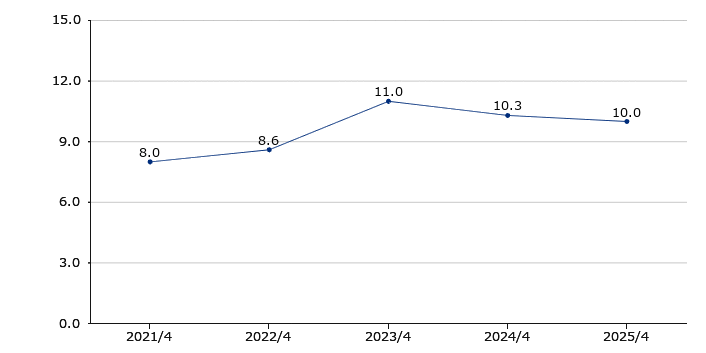
| Operating profit ratio | 8.0 | 8.6 | 11.0 | 10.3 | 10.0 |
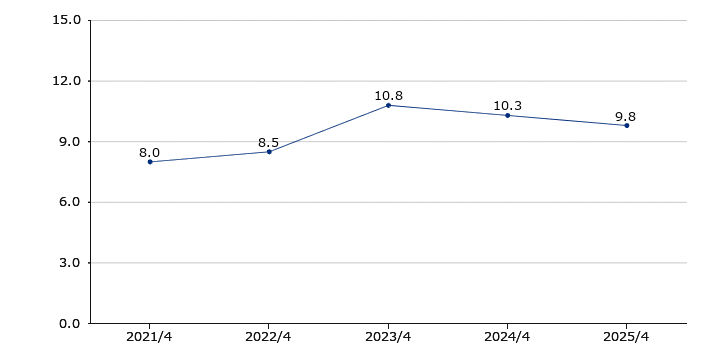
| Profit before tax ratio | 8.0 | 8.5 | 10.8 | 10.3 | 9.8 |
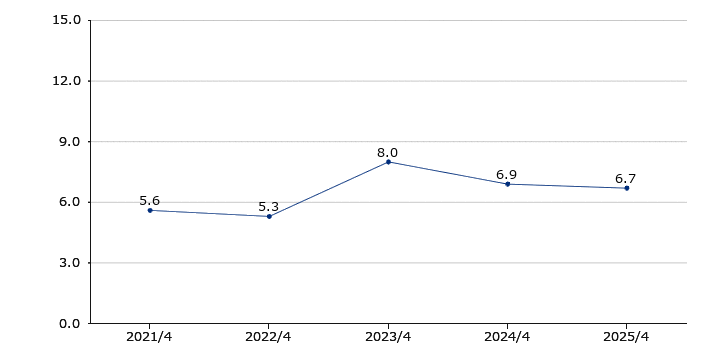
| Net profit ratio | 5.6 | 5.3 | 8.0 | 6.9 | 6.7 |
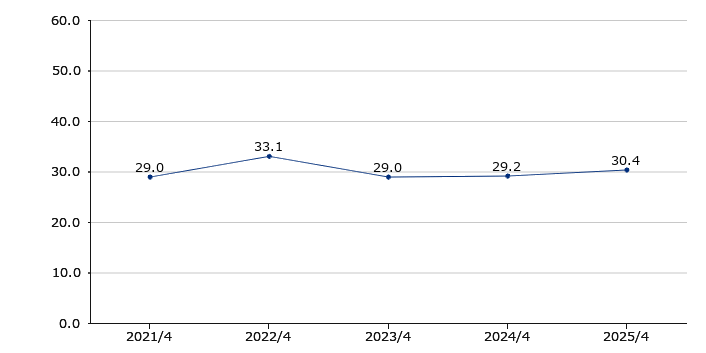
| ROE | 29.0 | 33.1 | 29.0 | 29.2 | 30.4 |
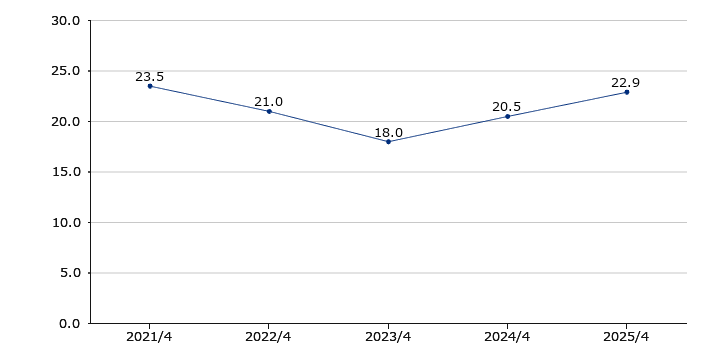
| ROA | 23.5 | 21.0 | 18.0 | 20.5 | 22.9 |
*Gross profit ratio = Gross profit / Revenue x 100
*Operating profit ratio = Operating profit / Revenue x 100
*Profit before tax ratio =Profit before tax / Revenue x 100
*Net profit ratio = Profit attributable to owners of the parent / Revenue x 100
*ROE = Profit attributable to owners of the parent / Average of equity attributable to owners of the parent at the beginning and end of the period x 100
*ROA = Profit attributable to owners of the parent / Average of total assets at the beginning and end of the period x 100

